|
|
Posted: 9/30/2017 |
|
Page Views: 38 |
| Hashtags: #Science #Earthquakes #Geology #Earthchanges |
| Examining the evidence that the number of severe earthquakes has been increasing significantly over the past two decades. |
| Estimated reading time: 3 minute(s) (548 words) |

The study of earthquakes is nothing new; the word that describes it, seismology, is actually
ancient Greek for "study of earthquakes." And they needed a word for it; they had a lot of
earthquakes so there were a lot of people interested in knowing more about the subject—especially
if such knowledge could be used to predict, and therefore minimize the damage from, them.
What the Greeks, and everyone after them until very recently, lacked, was electronics capable of
listening to the ringing of the earth. Because, as we now know, at certain wavelengths our planet
reflects sounds back into itself like a bell. And those are the very wavelengths that earthquakes
produce (along with nuclear detonations and even very large non-nuclear explosions).
The study of these echoes has resulted in a great increase in our knowledge of the earth,
far beyond the mere study of earthquakes. It has also resulted in our knowing when a nuclear
bomb is detonated on Earth, making it possible for us to monitor nuclear testing.
At its simplest, a seismograph is a device that records the most minute movements of the ground beneath it.
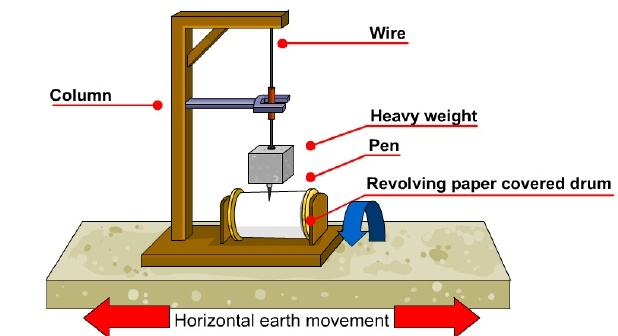
In point of fact, the ancient Greeks could have built such a device as shown above.
(The steadily moving strip of paper beneath the pen would have been the hardest part.)
But earth reverberations don't only occur in one direction. Vibrations in any
direction must be captured, including up-and-down; and the results must then be correlated
and combined with those from other seismograph locations to determine the origin point and
strength of the source.
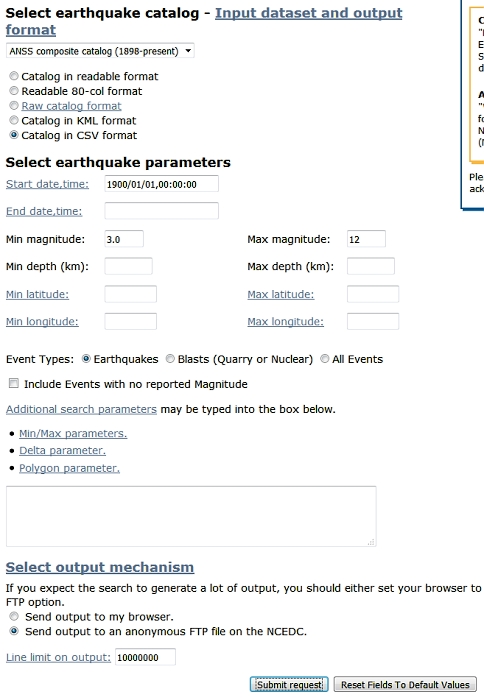
Now, science is all about reproducible results. So here's how I obtained the data and
got mine. I began with the USGS site described above, and made my way to the
ANSS Composite Catalog Search
hosted by the Northern California Earthquake Center, where I requested a list of all
earthquakes magnitude 3 and above, listed since the start of 1900. I asked for CSV format,
which will make it slightly easier to import into Microsoft Excel (or other spreadsheet).
Here's a chart that shows how the sheer number of earthquakes has increased
dramatically, starting in 1900:
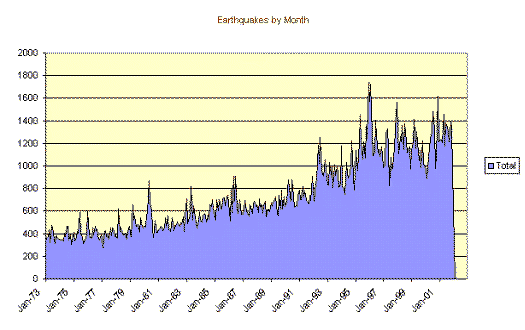
This is not an artifact of "improved seismographs". Our ability to detect
earthquakes has not improved since the fifties; the equipment is smaller, but
not more sensitive.
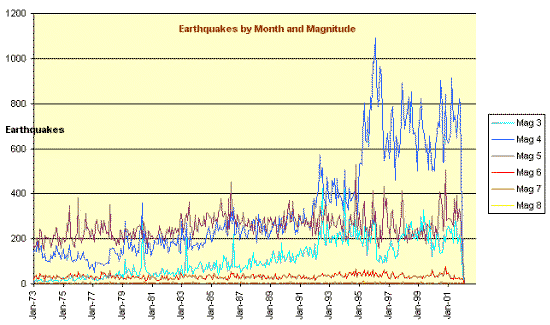
This next chart shows from where the increase in earthquake numbers has come:
mostly from magnitude 4.
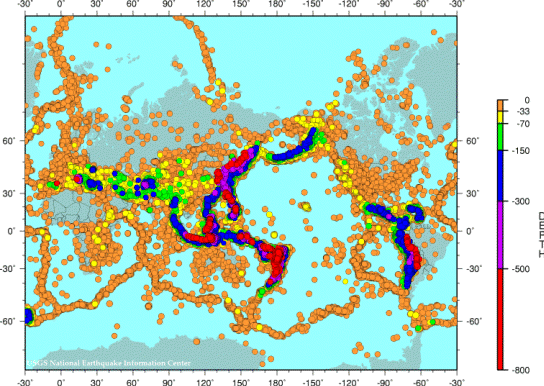
Here's a graphic showing where all these 'quakes occurred:
I'm not prepared to say what's happening…but it is clear that something
is. However, it may have reached its peak in 1996. This does bear continued
observation, however. Check here for updates as they come available, and at the
USGS site for the latest earthquake information.